The Activity Browser Display
The metric that you are viewing and the area where you click on the S2 // Diagnostics tab pane determines the data that displays in the Activity Browser.
Activities Irrespective of Tripwire Threshold
| Action | Analysis View | Activity Browser Results |
|---|---|---|
| Click on a ribbon description. | 
|
The Activity Browser displays all activities for the selected ribbon. |
| Click on a Phase header. | 
|
The Activity Browser displays all activities for the selected phase. |
| Click on a ribbon/phase intersection. | 
|
The Activity Browser displays all activities for the selected intersection. |
Activities That Trigger a Given Tripwire Threshold
| Action | Analysis View | Activity Browser Results |
|---|---|---|
| Click on an intersection metric. | 
|
The Activity Browser displays the activities for the selected intersection that triggered the tripwire. |
| Click on a ribbon analyzer cell. | 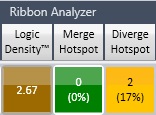
|
The Activity Browser displays the activities for the selected ribbon that triggered the tripwire. |
| Click on a phase analyzer cell. | 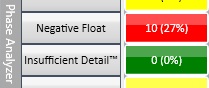
|
The Activity Browser displays the activities for the selected phase across all ribbons that triggered the tripwire. |
Activity Browser Modes
The Activity Browser can display activities in tabular, heat map, Gantt chart, scorecard, or detailed format.
Activity Browser Toolbar
The toolbar buttons are all context sensitive. For example, if you select a control account in the grid, the Trace buttons are disabled.
The filter only applies to the activities in the grid. If you have a mixed grid (for example, control accounts and activities), the filter ignores the control accounts.
Undock
You can click Undock in the Activity Browser Modes menu group to create a floating Activity Browser window for easier viewing and window sizing.